3-ary Boolean functions
| Studies of Boolean functions |



Compare
 A039754
There are = 256 3-ary Boolean functions, like set operations or logical connectives.
This Venn diagram ![]() , representing the intersection of 3 sets, or the conjunction of 3 statements respectively, gives an example of a 3-ary Boolean function.
, representing the intersection of 3 sets, or the conjunction of 3 statements respectively, gives an example of a 3-ary Boolean function.
Equivalence classes
[edit | edit source]The set of 256 functions can be parted into various equivalence classes.
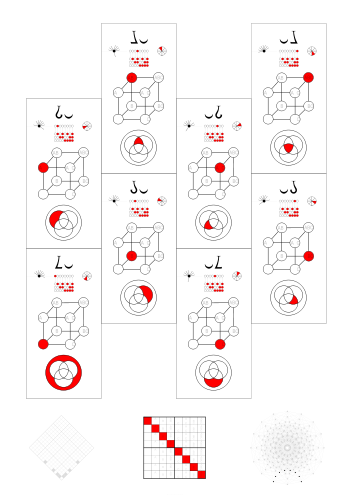
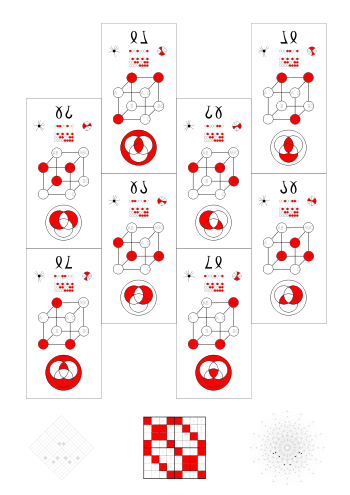
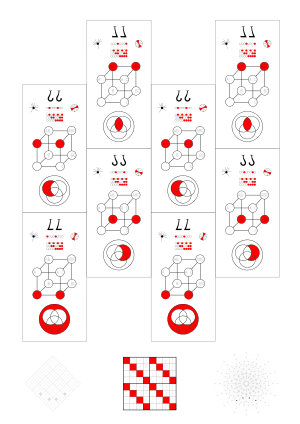
The most basic way to do that are the 46 small equivalence classes (secs). Functions belong to the same sec, when they can be expressed by each other by negating arguments. There are 3 arguments that can be negated, so there can be up to = 8 different functions in a sec.
When binarily colored cubes can be transformed into each other by mirroring and rotation, they are essentially the same.
The corresponding Boolean functions are often called equivalent and belong to the same big equivalence class (bec).
| wec: 5 | |
| sec: |
bec: |
| gsec: 30 | gbec: 14 |
| ggsec: 18 | ggbec: 8 |
The following sequences show the number of secs and becs by weight:
                weight   =   0   1   2   3   4   5   6   7   8
secs: A054724(3, 0..8)   =   1   1   7   7  14   7   7   1   1
becs: A039754(3, 0..8)   =   1   1   3   3   6   3   3   1   1
The following sequences show the number of secs and becs by number of functions in each sec:
                             1    2    4    8
secs: A227725(3, 0..3)   =   2    7   14   23
becs:                        2    3    6   11
Permutations of functions in a bec
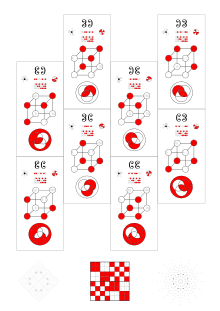
[edit | edit source]Theoretically a bec could have 3! * 23 = 6 * 8 = 48 functions, but the largest becs have only 24. (There are some becs of 4-ary functions with the highest possible number of functions, e.g. this one.)
| permuting all 3 arguments | ||
|---|---|---|
|
| permutations of functions in a sec | ||
|---|---|---|
 Each of the six files corresponds to a permutation of (A, B, C). |
 |
 |
| permuting 2 arguments | |||
|---|---|---|---|
|
Nonlinearity
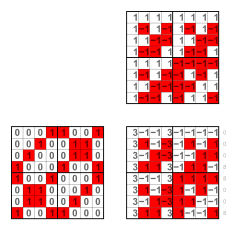
[edit | edit source]The nonlinearity of a function is the smallest Hamming distance it has from one of the 16 linear functions, i.e. from a row of the binary Walsh matrix or its complement.
The functions in wec E0 are the linear functions, i.e. those with nonlinearity 0. The functions in wec O have nonlinearity 1, and all others have nonlinearity 2.
There are no 3-ary bent functions.
| Nonlinearity | ||
|---|---|---|
 |
 |
 |
Walsh spectrum
[edit | edit source]
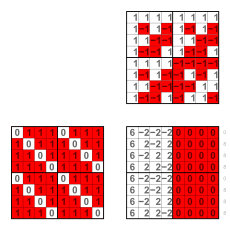
has the Walsh spectrum [1]
and the binary Walsh spectrum . The latter is row 1 of the Walsh matrix.
The Walsh spectrum of a Boolean function is the product of its binary string (as a row vector) with a Walsh matrix.
The first entry of the Walsh spectrum is the functions digit sum, and all entries have the same parity.
In the following chapter Walsh spectra are shown in the "by ggbec" sections.
Walsh spectra of the same sec (which differ only in the signs of their entries) are always shown in the same file.
The Walsh spectra of complements sum up to . [2]

Further the binary Walsh spectra are always shown by the red squares in the background. They are always rows of a binary Walsh matrix - or, in other terms, exclusive disjunctions of unnegated arguments.
The functions with odd digit sum, which make up wec O, have each binary Walsh spectrum one time in every sec.
The functions with even digit sum, which make up the other four wecs, have always the same binary Walsh spectrum in the same sec:
| = 0000 0000 | in wec E0 | ||||||||||||
| = 0101 0101 | or | = 0011 0011 | or | = 0000 1111 | in wec E1 | ||||||||
| = 0110 0110 | or | = 0101 1010 | or | = 0011 1100 | in wec E2 | ||||||||
| = 0110 1001 | in wec E3 |
Functions with the same binary Walsh spectrum
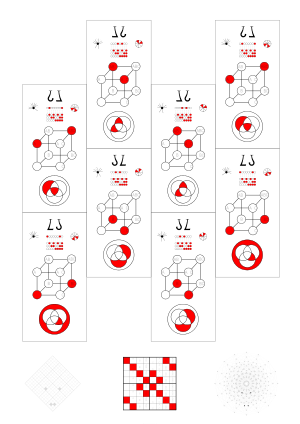
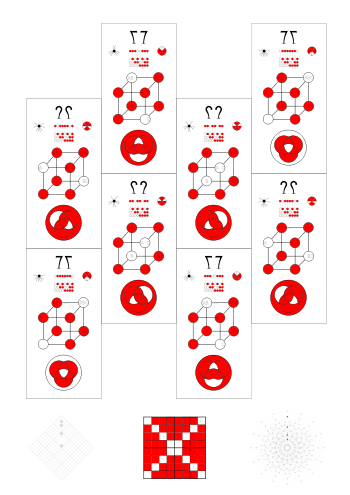
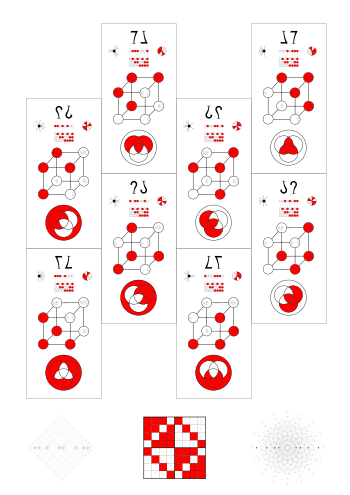
[edit | edit source]In the diagrams in this section the even functions are shown in red, and the odd ones (i.e. those in wec O) in yellow. Each odd function differs in the lowest bit (numerically: by 1) from an even function with the same binary Walsh spectrum. So in the octeract graphs each red vertex is connected to a yellow vertex by an edge of the direction corresponding to the lowest bit (like the edge connecting vertices 0 and 1). The pattern of the red vertices is always symmetrical to the main axes. Surprisingly the yellow vertices are also symmetrical, but to axes tilted to the left or to the right (indicated by \ or / in the table).
| 3 | |
|---|---|
|
| 2 | |||
|---|---|---|---|
|
| 1 | |||
|---|---|---|---|
|
| 0 | |
|---|---|
|
Nested equivalence classes
[edit | edit source]Overview
[edit | edit source]
The matrix on the right shows the 256 functions arranged in a way similar to the Hasse diagram, which is an octeract graph.
The colors indicate the five wecs, as shown in the table below.
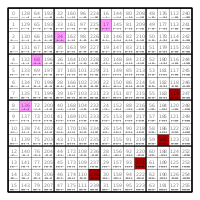
The two following matrices are examples of a gbec and a ggsec. Both contain the sec 26. Files like these are in the collapsible boxes below in boxes labeled Positions.
These matrices are symmetric to the main diagonal, because they contain complete secs. They are also symmetric to the antidiagonal, because they contain all the complements, and complements are symmetric about the center of the matrix. The ggsec matrices are also symmetric about the central axes, because they contain all the half-complements. Left half-complements are vertically, and right ones are horizontally symmetric to each other.
 |
 |
| Hasse diagram and diamond matrix | |
|---|---|
 |
 |
| On the bottom of each sec file (e.g. this one) the positions of the functions are shown in the octeract graph and the diamond matrix. | |
| O nonlinearity 1 |
E0 nonlinearity 0 |
E1 nonlinearity 2 |
E2 nonlinearity 2 |
E3 nonlinearity 2 | |||||||||||||||||||||||||||||||||||||||||||||||||||||||||||||||||||||||||||||||||||||||||||||||||||||||||||||||||||||||||||||||||||||||||||||||||||||||||||||||||||||||||||||||||||||||||||||||||||||||||||||||||||||||||||||||||||||||||||||||||||||||||||||||||||||||||||||||||||||||||||||||||||||||||||||||||||||||||||||||||||||||||||||||||||||||||||||||||||||||||||||||||||||||||||||||||||||||||||||||||||||||||||
| by ggbec ggbec 1 with 64 functions ggbec 22 with 64 functions |
by ggbec ggbec 0 with 2 functions ggbec 15 with 6 functions ggbec 60 with 8 functions |
by ggbec ggbec 3 with 48 functions |
by ggbec ggbec 6 with 48 functions |
ggbec 23 with 16 functions | |||||||||||||||||||||||||||||||||||||||||||||||||||||||||||||||||||||||||||||||||||||||||||||||||||||||||||||||||||||||||||||||||||||||||||||||||||||||||||||||||||||||||||||||||||||||||||||||||||||||||||||||||||||||||||||||||||||||||||||||||||||||||||||||||||||||||||||||||||||||||||||||||||||||||||||||||||||||||||||||||||||||||||||||||||||||||||||||||||||||||||||||||||||||||||||||||||||||||||||||||||||||||||
| by ggsec | by ggsec | by ggsec | by ggsec | ||||||||||||||||||||||||||||||||||||||||||||||||||||||||||||||||||||||||||||||||||||||||||||||||||||||||||||||||||||||||||||||||||||||||||||||||||||||||||||||||||||||||||||||||||||||||||||||||||||||||||||||||||||||||||||||||||||||||||||||||||||||||||||||||||||||||||||||||||||||||||||||||||||||||||||||||||||||||||||||||||||||||||||||||||||||||||||||||||||||||||||||||||||||||||||||||||||||||||||||||||||||||||||
|
|
|
|
| |||||||||||||||||||||||||||||||||||||||||||||||||||||||||||||||||||||||||||||||||||||||||||||||||||||||||||||||||||||||||||||||||||||||||||||||||||||||||||||||||||||||||||||||||||||||||||||||||||||||||||||||||||||||||||||||||||||||||||||||||||||||||||||||||||||||||||||||||||||||||||||||||||||||||||||||||||||||||||||||||||||||||||||||||||||||||||||||||||||||||||||||||||||||||||||||||||||||||||||||||||||||||||
The tables above show how the equivalence classes are nested in each other. Each table shows the equivalence classes in a wec.
The vertical axes show ggsecs, gsecs and secs, and the horizontal ones show ggbecs, gbecs and becs.
The entries in the matrices show which secs belong to which becs.
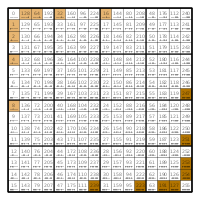
The numbers in these fields show how many functions are in each sec. A dark red background tells that the sec contains a monotonic function.
wec O with 128 functions
[edit | edit source]wec O ordered by ggbec
[edit | edit source]wec O ordered by ggsec
[edit | edit source]| wec O ordered by ggsec | ||||||||||||||||||||||||||||||||||||||||||||||||
|---|---|---|---|---|---|---|---|---|---|---|---|---|---|---|---|---|---|---|---|---|---|---|---|---|---|---|---|---|---|---|---|---|---|---|---|---|---|---|---|---|---|---|---|---|---|---|---|---|
|
| ||||||||||||||||||||||||||||||||||||||||||||||||
wec E0 with 16 functions
[edit | edit source]wec E0 ordered by ggbec
[edit | edit source]| wec E0 ordered by ggbec | ||||||||||||||||||||||||||||||||||||||||||||||||||
|---|---|---|---|---|---|---|---|---|---|---|---|---|---|---|---|---|---|---|---|---|---|---|---|---|---|---|---|---|---|---|---|---|---|---|---|---|---|---|---|---|---|---|---|---|---|---|---|---|---|---|
|
| ||||||||||||||||||||||||||||||||||||||||||||||||||
wec E0 ordered by ggsec
[edit | edit source]| wec E0 ordered by ggsec | ||||||||||||||||||||||||||||||||||
|---|---|---|---|---|---|---|---|---|---|---|---|---|---|---|---|---|---|---|---|---|---|---|---|---|---|---|---|---|---|---|---|---|---|---|
|
| ||||||||||||||||||||||||||||||||||
wec E1 with 48 functions
[edit | edit source]wec E1 ordered by ggbec
[edit | edit source]| wec E1 = ggbec 3 with 48 functions | ||||||||||||||||||||||||||||||||||||||||||
|---|---|---|---|---|---|---|---|---|---|---|---|---|---|---|---|---|---|---|---|---|---|---|---|---|---|---|---|---|---|---|---|---|---|---|---|---|---|---|---|---|---|---|
|
| ||||||||||||||||||||||||||||||||||||||||||
wec E1 ordered by ggsec
[edit | edit source]| wec E1 ordered by ggsec | ||||||||||||||||||||||||||||||||||||
|---|---|---|---|---|---|---|---|---|---|---|---|---|---|---|---|---|---|---|---|---|---|---|---|---|---|---|---|---|---|---|---|---|---|---|---|---|
|
| ||||||||||||||||||||||||||||||||||||
wec E2 with 48 functions
[edit | edit source]wec E2 ordered by ggbec
[edit | edit source]| wec E2 = ggbec 6 with 48 functions | |||||||||||||||||||||||||||||||||||||||
|---|---|---|---|---|---|---|---|---|---|---|---|---|---|---|---|---|---|---|---|---|---|---|---|---|---|---|---|---|---|---|---|---|---|---|---|---|---|---|---|
|
| |||||||||||||||||||||||||||||||||||||||
wec E2 ordered by ggsec
[edit | edit source]| wec E2 ordered by ggsec | |||||||||||||||||||||||||||||||||
|---|---|---|---|---|---|---|---|---|---|---|---|---|---|---|---|---|---|---|---|---|---|---|---|---|---|---|---|---|---|---|---|---|---|
|
| |||||||||||||||||||||||||||||||||
wec E3 with 16 functions
[edit | edit source]| wec E3 = ggbec 23 = ggsec 23 with 16 functions | ||||||||||||||||
|---|---|---|---|---|---|---|---|---|---|---|---|---|---|---|---|---|
| ||||||||||||||||
Monotonic functions
[edit | edit source]
The right Hasse diagram in the file on the right shows the 20 monotonic 3-ary Boolean functions.
If a sec has a monotonic function, all the secs in the gbec and gsec it belongs to also have one. So one can call secs, gbecs and gsecs monotonic, when they contain monotonic functions. There are 6 gbecs and 12 gsecs that are monotonic in this sense. Their collapsible boxes are marked with Tudor roses ![]() .
.
In the above tables that show the nesting of the equivalence classes the monotonic secs have a dark red instead of a black background.
| gbec | weight | gsec |
|---|---|---|
| 0 | 0, 8 | 0 |
| 1 | 1, 7 | 1 |
| 3 | 2, 6 | 3, 5, 17 |
| 7 | 3, 5 | 7, 19, 21 |
| 15, 23 | 4 | 15, 23, 51, 85 |
All wecs except E2 contain monotonic functions.
Subgroups of nimber addition
[edit | edit source]16 secs with in all 8 + 7*4 + 7*2 + 1 = 51 functions are related to subgroups of nimber addition:
 |
 |
In each sec matrix its leading function appears in a sona pattern. This pattern is 0 in N(0) iff the sec contains 8 different functions. All the other different sona patterns appear only in the sec matrices of the actual sonas between 1 and 15 and their Boolean complements. Each gbec is marked in green with its sona-bec, and each gsec is marked with its sona-sec.
Complements in secs
[edit | edit source]There are two kinds of secs that are their own complements (i.e. complete gsecs): Those with sona rank 2, marked as N(2, ...), and the following seven secs containing 8 functions each:
| Complements in 8-element secs in a cube | |||||||||||||||||
|---|---|---|---|---|---|---|---|---|---|---|---|---|---|---|---|---|---|
|
The position of the complement in the sec cube corresponds to the position of the sec cube in the big cube.
|
Gbecs by similarity to 4-ary sec matrix
[edit | edit source]In the octeract matrices of the gbecs it can be seen, that they belong together in a way that is independent of ggbecs and wecs. Their pattern is part of a sec matrix of one of the five 4-ary exact-value functions. On the left the functions in these gbecs are shown in the Hasse diagram.
0
[edit | edit source]
|
 0 |
 gbec 0 |
 gbec 60 |
 gbec 24 |
|---|
1
[edit | edit source]
|
 1, 2, 4, 8 |
 gbec 1 |
 gbec 25 |
|---|
| gbec 1 and gbec 25 in a cube | |||||||||||||||||
|---|---|---|---|---|---|---|---|---|---|---|---|---|---|---|---|---|---|
|
| smallest 4-ary sec matrices | ||||
|---|---|---|---|---|
|
2
[edit | edit source]
|
 3, 5, 6, 9, 10, 12 |
 gbec 3 |
 gbec 30 |
 gbec 6 |
 gbec 27 |
|---|
| gsecs separately | ||||||||||||||||||||||||||||||
|---|---|---|---|---|---|---|---|---|---|---|---|---|---|---|---|---|---|---|---|---|---|---|---|---|---|---|---|---|---|---|
| ||||||||||||||||||||||||||||||
| smallest 4-ary sec matrices | ||||||
|---|---|---|---|---|---|---|
|
3
[edit | edit source]
|
 7, 11, 13, 14 |
 gbec 7 |
 gbec 22 |
|---|
| gbec 7 and gbec 22 in a cube | |||||||||||||||||
|---|---|---|---|---|---|---|---|---|---|---|---|---|---|---|---|---|---|
|
| smallest 4-ary sec matrices | ||||
|---|---|---|---|---|
|
4
[edit | edit source]
|
 15 |
 gbec 15 |
 gbec 105 |
 gbec 23 |
|---|
References
[edit | edit source]- ↑ Compare Figure 1 in Walsh Spectrum Computations Using Cayley Graphs, by W. J. Townsend and M. A. Thornton
- ↑ Compare Property 1 (page 3 of the PDF) in The spectral test of the Boolean function linearity by P. Porwik


